
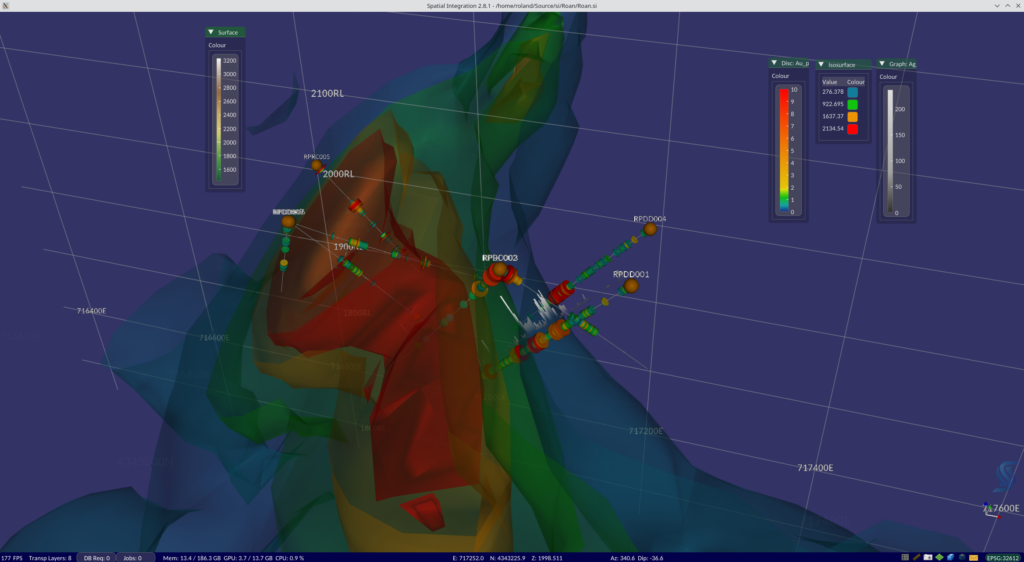
Version 2.8 of Spatial Integration is out, and it is the largest release we have shipped. There is a genuinely live connection to QGIS, SEGY seismic sections, user-defined streaming imagery, and a rendering pipeline that now manages its own level of detail against a frame rate you choose.
Here’s what’s included, and why each piece is there.
Before you install: the MSI
SI now ships as a code-signed MSI. The installer removes the previous version (if via MSI), registers the .si file extension and supports silent install for anyone deploying at scale.
One caveat: if you are coming from a version earlier than 2.7.0, you must manually uninstall the old .exe-based installation first. The MSI does not know about installations it did not create, and leaving one in place will give you two copies of SI on the machine.
SI can now be run safely from network drives. That said, SI is heavily optimised around local disk access and pulling data over a network is much, much slower. It works — but keep your data local if you can.
Dynamic resolution: pick a frame rate
In 2.8 you set a target frame rate and SI dynamically adjusts tile resolution to hold it. Memory usage is monitored at the same time and resolution is pulled back if you are heading for trouble.
The practical effect: a laptop with integrated graphics and a workstation with a discrete GPU both stay interactive on the same project, they just resolve to different levels of detail.
The QGIS pipeline
Two features here, and together they are probably the biggest change to day-to-day workflow.
QGIS Live Map link (Pro)
Using the Geoscience plugin for QGIS (v2.0), SI streams your current QGIS map canvas onto a surface. Layers, edits, symbology — whatever the canvas shows appears on the surface, and refreshes within about a second of you changing it in QGIS.
Setup is two clicks: Geoscience > Spatial Integration Link > Start Link in QGIS, then add the pre-existing QGIS Live Map source from the Image Sources tab of your Surface dialog. If the link is not available, a warning icon appears next to the source and clears itself as soon as the tile service becomes reachable again.
This closes a gap that has bothered us for a long time. QGIS is where 2D cartography and vector editing belong. SI is where the third dimension belongs. Now you can do both simultaneously, on the same screen, with no export step.PlayQGIS Live Map Link
QGIS style support, both directions
Styles now move freely between the two applications:
- Copy / Paste — put a style on the system clipboard in QGIS and paste it into SI, or the reverse. Styles copied between SI layers round-trip exactly, including colour ramps and transform anchor points.
- Import / Export .qml — read and write QGIS layer style files from the Style button on the symbology editor.
- Sidecar .qml files — if a .qml sits beside a data file with the same name, it is applied automatically the first time that layer loads.
- Paste Style and Paste Style to All are on the right-click menu for layers, visualisations and groups, so a whole group can be restyled in one action.
QGIS has no continuous vector renderer, so a continuous symbology exports as a graduated approximation — but SI also writes the exact settings into a private section of the file that QGIS ignores, so a round trip back into SI restores the original continuous style intact.
Getting data in
Drag and drop from your file manager. Drop one file or fifty, straight from Explorer, Dolphin or Finder. Where you drop determines what happens: onto the Height Sources tab and a raster becomes a height source; onto the 3D view and SI inspects the file — by opening it, not by trusting the extension — and routes it to the right loader. While you drag, the target under the pointer is outlined and a label at the cursor tells you exactly what the drop will do. Dialog file path boxes are drop targets too.
Custom streaming imagery: WMS, WMTS, TMS and XYZ (Pro). Define your own tile sources in Configure. WMS servers are set up via GetCapabilities — SI reads the published layer list, you tick the layers you want and drag to reorder them. Sources are saved with the project, support transparency, keep server credentials protected, and fall back to cached tiles when a server goes down rather than blocking the rest of the scene. Caches are listed with their disk usage in the Configure dialog and can be deleted individually.
SEGY seismic sections (Pro). Import SEGY files and display them as vertical curtains following the shot path, coloured by trace amplitude and fully tiled with level-of-detail. Both depth and two-way-time sections are supported, TWT converted using a velocity you supply. Trace header byte offsets are configurable and remembered between sessions, and the import dialog reports line length, trace spacing, coordinate ranges and the full textual header before you commit — which is the fastest way to confirm your byte offsets are right. Batch imports work provided the files share a processing run. Conversion to GeoTiff happens once per file; after that it loads in a moment.

Micromine block models (Pro). Load Micromine Extended Data (.DAT) block models as volumes, including rotated and sub-blocked models. Text fields are exposed as numeric category indices so they can drive symbology.
Working in the scene
- 3D graticule. A labelled reference grid drawn in the scene, not over it, so it is occluded by objects in front of it. Spacing adapts to zoom but always rounds to sensible numbers — 250, 500, 1000, never 337. Line and label colours are set independently, the target line count is configurable, and labels can be suffixed E, N and RL. Toggle with G.
- Perspective and orthographic views. Switch from the status bar. Orthographic exists for figures where scale must be constant across the whole image — sections, collar plans, anything measured off the printed page. Switching does not jump the view; the orthographic extents are matched to the perspective field of view at your look-at point.
- Legends and popout legends. Every layer and visualisation now has a legend entry, and the legend lists only what is currently visible. Individual items can be torn off and dropped anywhere around the view as permanent, semi-transparent guides next to the data they describe. Popouts update live, can be rolled up, and their positions are saved with the project. Colour swatches are editable directly from the legend or the popout — no dialog needed. Toggle with L.
- Screenshots on a keypress. F12 saves the 3D view. Output folder is set in Configure. Combine with orthographic and the graticule and you have a report figure with a true scale in about four seconds.
- More colour ramps. The CET perceptually uniform family and seismic ramps are in, terrain and elevation ramps are improved, and every ramp can now be reversed.

Also worth knowing
- Custom coordinate systems now travel inside the project file.
- Project databases are locked while in use, so a second copy of SI or a backup running concurrently cannot corrupt them.
- Lock mouse pan and rotate to axes by holding X, Y & Z keys.
- Load point data with default height.
- Streamed tiles no longer stall loading of local surfaces and drillholes.
- Large GIS line and triangle data loads faster.
2.8.1 is available now. If you are upgrading from anything before 2.7.0, uninstall the old version first — then enjoy the rest of it.