
Spatial Integration can now load and visualise volume data!
Volumes are an area of space that has been discretised into cells, each containing a value, for example grade block models and geophysics inversions.
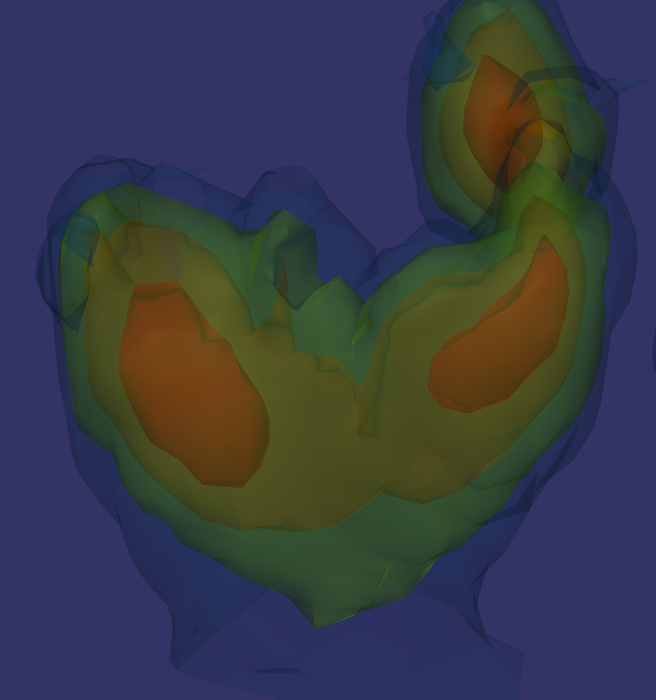
You can visualise your volume using a series of isosurfaces (3D contours) at defined values or as blocks within a threshold. Both can be controlled using real-time sliders to get the perfect display to describe your volume. Colours are automatically updated using your favourite colour scheme and adjustable transform, plus the transparency of each isosurface or block threshold can be set individually to see through nested shells.
Volume layers also support an Outline (bounds) visualisation and Cell Edges so you can see exactly how the volume is split up.
Native Support for 5 Core Topologies
To maintain 100% data integrity without forced resampling, Spatial Integration natively mirrors the exact mathematical structure of your source grid:
- Image: Uniform, regular grids where every cell is identical.
- Rectilinear: Variable cell sizes per row, column, and level (Tensor meshes).
- Structured: Regular, connected cells of irregular shape to model curvilinear geology.
- Unstructured: Arbitrary topologies and irregular layouts (including Tetrahedral meshes).
- Tree: Adaptive refinement where large cells subdivide into smaller child cells for high-resolution detail (such as VTK HyperTree grids, sub-blocked models, and Octrees).
Broad Interoperability & Industry Formats
Load your data directly without painful format conversions. We support a wide range of standard file types:
- Modern VTK (XML):
.vti(Image),.vtr (Rectilinear),.vts (Structured),.vtu (Unstructured), and.vth(HyperTree). - Legacy VTK: Standard
.vtkwrappers and ASCII grids. - UBC / SimPEG: Direct loading of Tensor and Octree meshes.
- Geophysics: Loke XYZ IP/Resistivity inversion exports.
- …with more formats on the way!
Note that formats can be converted to modern VTK formats right from the layer opening dialog.
As with all Spatial Integration layers, you can apply one or more clipping planes to your data and you can mix any coordinate reference systems. Transparency can also be applied at layer or visualisation levels.
See the Volume Tutorial on our YouTube channel.
Volume visualisation is a Professional Edition feature.