
A video tutorial is available for this topic.
You will need one or more georeferenced elevation grids and, optionally, georeferenced images to create an elevation surface. The grids and images can be in any coordinate reference system, can be different resolutions, have different origins and be different file formats.
Hover over the Surface icon from the left flyout and click New Elevation Surface…. This opens the Surface dialog.
By default, your new surface is called "Surface". If you have multiple elevation surfaces then you can provide a more appropriate name here.
The visibility and opacity of the surface can be set in this dialog, but it is more convenient to access these from the Surface flyout menu in the main scene.
The Default Height determines the height value assigned to portions of the surface with no data within the surface bounds. This will only apply if the Fill box is checked. The surface bounds are determined by your Height Sources when the scene is using a projected coordinate system and encompases the entire globe when using a geocentric coordiante system. The main use for the Default Height and Fill boxes is to provide a surface for imagery and SRTM gaps when displaying the Earth as a globe.
Height Sources
Add one or more locally stored elevation grids to the Height Sources by clicking the Add Height Source button. Choose your grid and click OK. Remember, the grid must contain raw elevation values, not be an image of elevation. If this is the first data in your project and the elevation grid has a valid Coordinate Reference System (CRS) then the viewer will be set to that CRS. You can change it later if you want.
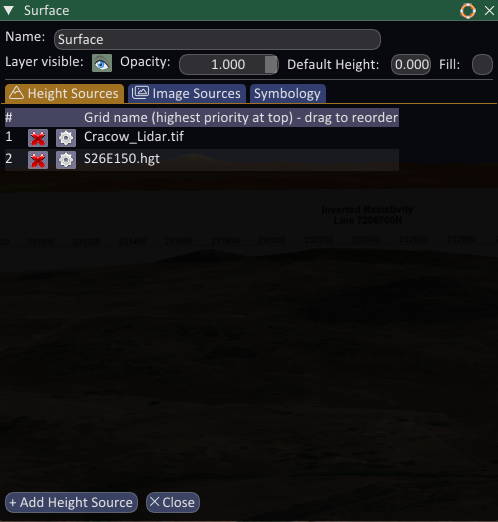
You can add several height sources, just ensure that the most detailed one is at the top of the list. You can drag and drop within the list to re-order them. Don’t worry if they use different CRS, Spatial Integration can handle it. If your elevation grids are large, Spatial Integration will take a few moments to generate overviews. These are compatible with other software, such as QGIS, so it only has to be done once.
Height fields can be removed by clicking the red cross button next to the source.
The configuration button next to each source allows you to set the CRS if it isn’t in the source file or is incorrect. It also allows you to set a No-Data value. This will usually be embedded in the source file and won’t normally need to be set.
Image Sources
You can now select the Image Sources tab and load some image overlays. The order is important if you want to show multiple overlapping images concurrently and if you intend to blend them with transparency. Images can be drag and dropped within the list to reorder them.
As with elevation grids, Spatial Integration will handle different CRS, resolutions and very large images.
The Pro Edition allows you to use up to 16 image overlays, while the Community Edition limits you to 2.
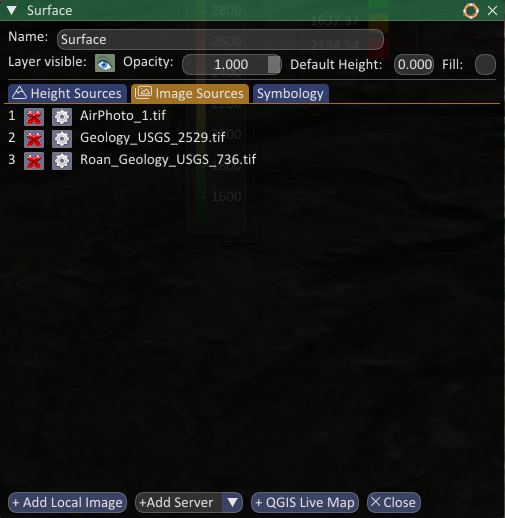
You can remove an image by clicking the red cross button next to the source.
The configuration button next to each source allows you to set the CRS if it isn’t in the source file or is incorrect. You can also set the opacity, although this is more conveniently adjusted from the Surface flyout menu.
The No-Data colour can be set and adjusted in real-time using the check box and colour chooser. This will apply the no-data value while rendering the scene after interpolation has been applied between pixels, which can result in some feathering of colours around the margins of no-data zones. The Save button will write the transparent colour back into the source file (if possible), so that transparency is applied during image loading, providing a more visually appealing result. Note that some images use lossy compression which results in the no-data values being not quite the correct no-data value, so you get a noisy edge around the margin of the image. The no-data colour is usually embedded in the source image.
- Local Files: Just about any image format with the coordinates embedded or with the help of a World file. The CRS from the image file will be used if present, or it can be defined in Spatial Integration.
- Streaming Servers: Spatial Integration supports stremaing data from XYZ servers, TMS, WMTS and WMS. (Pro feature)
- QGIS Link: Stream your active QGIS map directly onto a Spatial Integration surface and have it update automatically. (Pro feature)
Symbology
If you intend to show any of the elevation surface without an overlay, then you might want to apply an elevation-based colour. To do this, go to the Symbology tab.
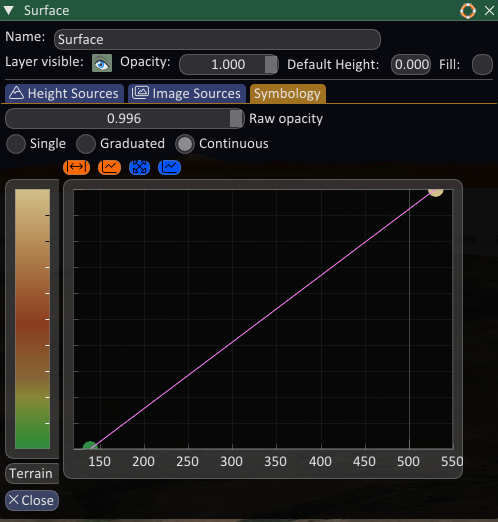
You can change the Single colour by clicking on the default grey square and selecting a new one using the colour chooser. A contoured image can be produced by selecting Graduated symbology and entering the height bands limits and desired colour.
The easiest and most visually appealing way to show elevation surfaces is to select Continuous, then click the orange button on the right to set a linear transform from data limits. Change the colour scheme by clicking on the label below the colour bar and selecting "Terrain" or "Elevation" if you have water that you want to show in blue. The only difference between Terrain and Elevation colour schemes is a thin band of blue at the lowest value. You can then move the transform anchor points around with the mouse, add a new anchor point by double clicking, or delete an anchor point by right clicking on it.
The Symbology tab also includes an option for Raw Opacity. This sets the opacity for the surface NOT covered by image overlays, but does not affect the opacity of images. This is useful when you have a large height field, but are only interested in a small part of it where you have an image overlay. This is only a visual effect, so the status bar mouse coordinates, the Information tool and the Measure tool will still see the raw surface values.