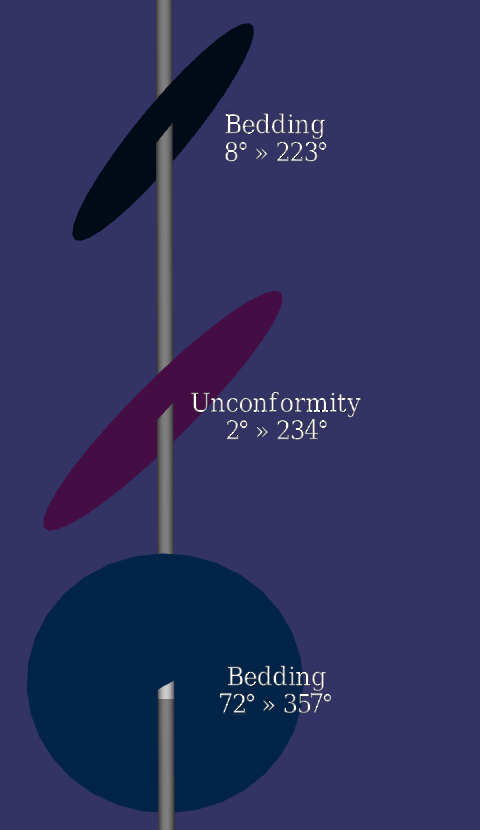
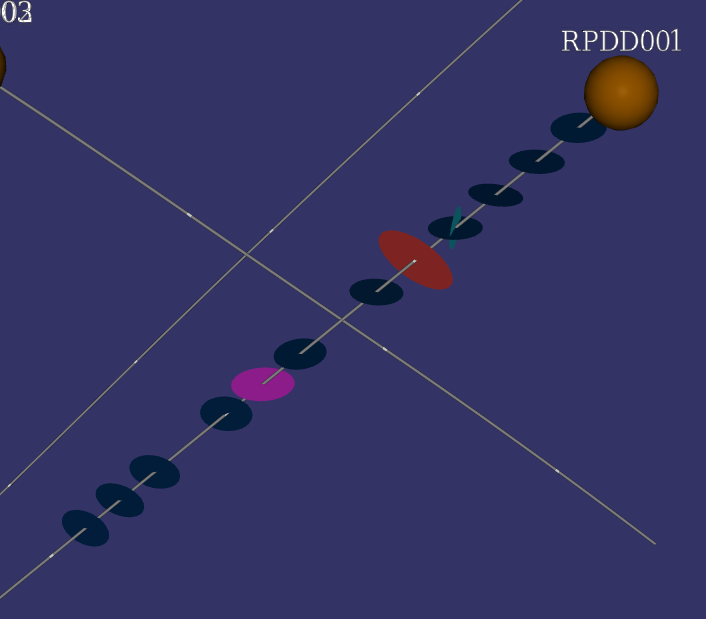
The Structure visualisation draws an oriented disc at each structural measurement down the hole. Unlike the ordinary disc visualisation, whose discs sit square across the hole, a structure disc is tilted into the plane of the measured feature, so a bedding, fracture or vein plane is shown at its true orientation in space.
Structure is drawn from a point table that contains a dip and a dip direction for each measurement. If your data holds core relative alpha/beta angles instead, convert them first with the Alpha/Beta to Dip/Dir button in the Drill Manager.
Adding the Visualisation
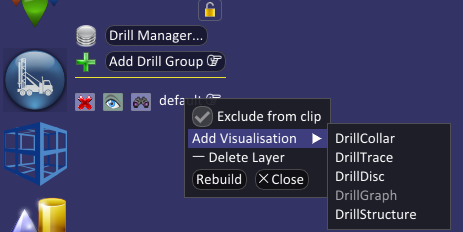
Structure is not one of the default visualisations, so you need to add it yourself. Right click on the drill layer, choose Add Visualisation, then DrillStructure.
Choosing the Orientation Fields
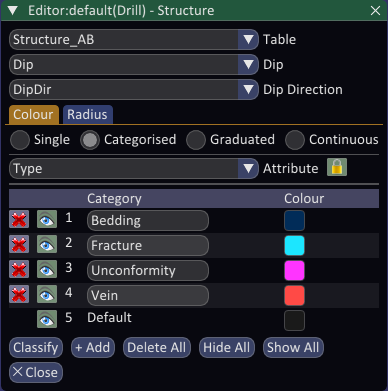
Open the editor by clicking the Structure button. At the top, select the Table holding your structural measurements, then set the Dip and Dip Direction dropdowns to the columns that hold those angles.
Spatial Integration will try to guess the dip and dip direction columns from their names when you choose the table, but you should always check the selections and correct them if needed.
Colour and Radius
Like the disc visualisation, a structure disc has independent Colour and Radius symbology classes, each of which can be Single, Categorised, Graduated or Continuous. A common approach is to colour the discs by structure type: a Categorised class over a Type field, so bedding, fractures, veins and unconformities are each drawn in their own colour, as shown above.
The two classes are locked to the same attribute by default. Click the lock icon next to the Attribute dropdown to unlock them when you want Colour and Radius to be driven by different fields, for example colouring by structure type while sizing by a confidence or intensity value.
Labels
Turn labels on by clicking the label button next to the Structure visualisation button. Every label shows the measured orientation as dip » dip direction in degrees, for example 45° » 234°.
When you also choose a symbol colour attribute (such as structure type), its value is shown on the line above the orientation.