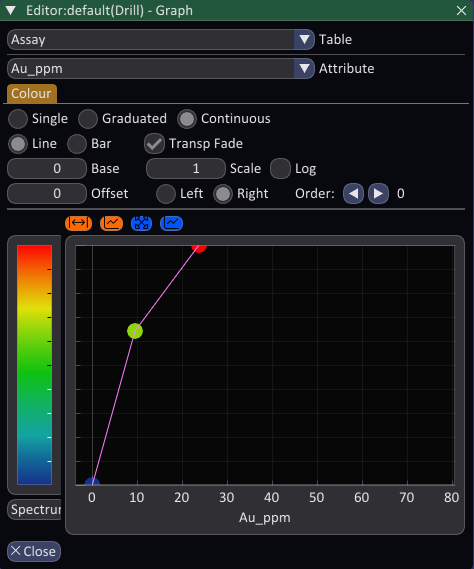
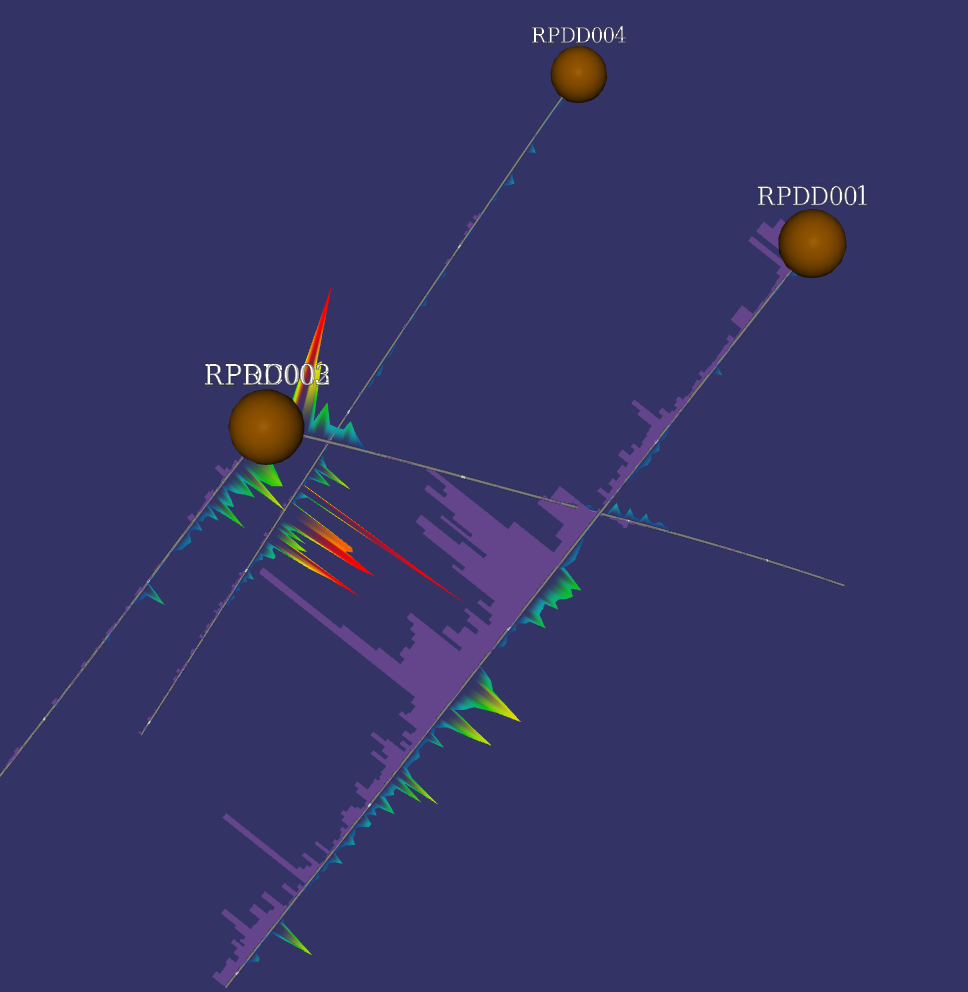
The Graph visualisation plots a numeric downhole field as a graph running alongside the hole, in the manner of a downhole log.
Professional Edition: the Graph visualisation is only available with a Professional licence. If your licence does not include it, the menu item will appear greyed out.
Because it is not one of the default visualisations, you add one or more Graphs yourself. Hover over the drill layer to open its flyout, choose Add Visualisation, then DrillGraph. Open its editor with the Graph button to configure it.
Choosing the Data
At the top of the editor, select the downhole Table and the numeric Attribute to graph. Both interval and point tables are supported. For point tables a Max Gap control limits how far the graph will bridge between adjacent points before it breaks the line, so gaps in the data are not joined across large intervals.
Graph Style
The graph can be drawn as a Line or as a filled Bar log:
- Line traces the value continuously down the hole.
- Bar draws a filled histogram style bar for each sample.
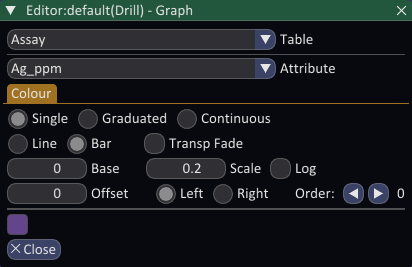
A number of controls shape how the values are drawn:
- Base sets the value at which the graph sits against the hole. Values above the base extend outward.
- Scale controls how far the graph extends for a given value. Increase it to exaggerate small variations.
- Log switches the value axis to a logarithmic scale, useful for data spanning several orders of magnitude.
- Offset shifts the whole graph away from the trace, so multiple graphs can be stacked side by side without overlapping.
- Left / Right chooses which side of the hole the graph is drawn on.
- Order arrows set the drawing order when several graphs overlap to prevent jittering.
- Transp Fade fades the fill with transparency so overlapping graphs remain readable.
Colour
The Colour tab is a symbology class that colours the graph. As with the discs it can be Single, Graduated or Continuous. Colouring by the graphed value with a Continuous ramp adds a second visual cue on top of the graph shape, so high values stand out both by their extent and their colour.