
Once a drill group has been added to the scene (see the Drill Manager tutorial), Spatial Integration automatically installs a set of visualisations on the drill layer. Each visualisation draws a different aspect of the holes and can be configured independently from the layer flyout menu.
The two visualisations covered on this page Collar and Trace are ready to use as soon as the group is added. The downhole visualisations that draw your logged data are covered in the Downhole Display section at the bottom of this page.
To open a visualisation’s editor, hover over the drill layer to bring up its flyout, then click the visualisation’s symbology button.
Collars
The Collar visualisation draws a marker at the top of each hole, at the collar position. Collars are the quickest way to see where your holes are and to pick out a hole in a crowded scene.
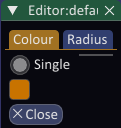
The collar editor lets you set the colour and size of the collar markers. At present, collars are only drawn with a single colour and radius.
Traces
The Trace visualisation draws the desurveyed path of each hole from the collar to the end of hole. The trace makes the true three‑dimensional shape of each hole visible, including any deviation recorded by the downhole surveys.
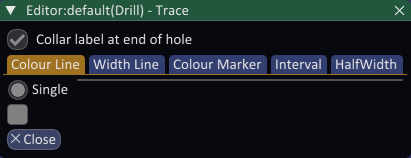
The trace is drawn as a ribbon by default, although you can choose to use a line from the Configure dialog. Colour and width can be set to single values. Downhole depth markers are user configurable for both distance and colour.
Turning labels on will show the depth alongside depth markers and show the hole depth at the bottom of the hole. A checkbox controls whether the hole name is also shown at the bottom of the hole.
Downhole Display
The remaining visualisations render the interval and point data you loaded through the Drill Manager. One or more of each of these visualisations can be added from the layer flyout menu by right-clicking on the layer and choosing Add Visualisation, then configured to show the field you are interested in.