Before creating sections, you must have processed your drill holes.
Sections are generated by defining start and end coordinates, a width and which layers to include in the section. Sections will be transformed to a new coordinate system based on distance along the section from the start point and the real elevation as calculated in the Desurvey stage. This means that your sections are displayed on the same map canvas as the rest of your data. Usually this will be in a different part of space to your normal, plan-based spatial data and won’t be a problem. If your regular data uses coordinates near 0E, 0N, then you might want to move it all under a single group in the Layer Tree so that you can switch it on and off easily. All sections will be placed in their own Section group automatically.
Geoscience will store all the metadata required to recreate a section in your QGIS Project file. Generated section layers are only Memory Layers and will be lost when QGIS is closed, however they can easily be regenerated when you open your project again. Similarly, you can remove sections from the Layer Tree and then regenerate them later. The only way to delete sections permanently is via the Section Manager.
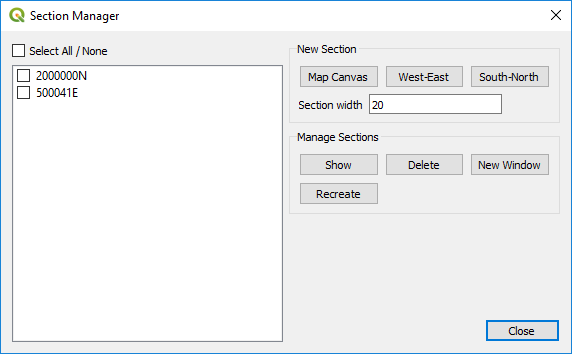
The Section Manager displays all sections in the box on the left. You can double click sections in the box to display them. Also, the Section layer tree group is set as mutually exclusive, so you can switch between sections by clicking their groups on and off.
You can Recreate or Delete multiple sections by selecting their check boxes before clicking the appropriate buttons. When you recreate a section, Geoscience will replace any existing empty Memory Layers already in the section’s group in the layer tree. This allows you to have extra layers, such as interpretation layers, under the section group. The Geoscience section layers will just be recreated around them.
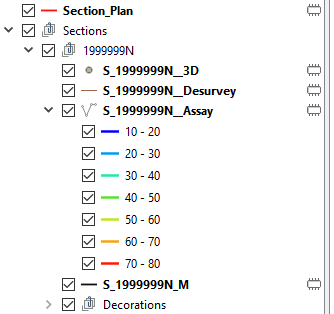
Geoscience will create a top level Group called Sections. All sections you create will be placed under this in their own groups so that you can switch entire sections on and off.
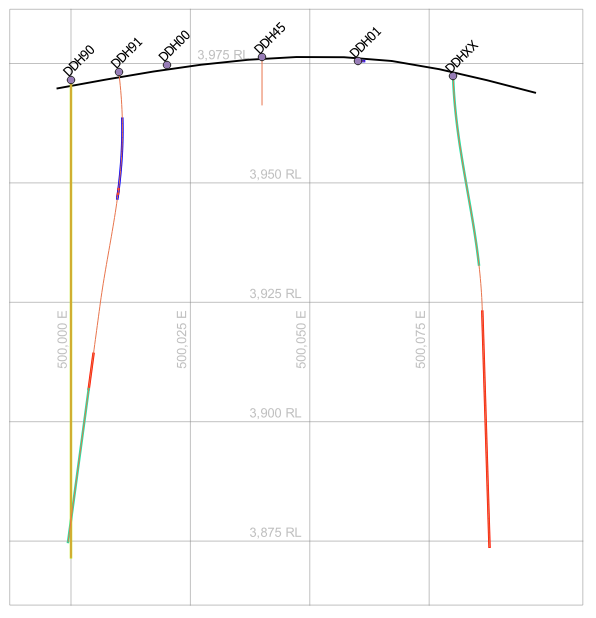
Sections are normal QGIS layers. You can use any of the Symbology, labelling tools etc as normal. You can also create a Layout to produce scaled and annotated plots.
Geoscience will generate three grids and a border with every section. These are placed in a Decorations group so that they can be toggled on and off together. The three grids show where lines of Easting, Northing and Elevation cross the section line. If your section is close to west-east or south-north then one of the grids will be turned off by default. You can turn any of the three grids or border on or off independently.
To generate and display sections.
- When a section is created, Geoscience copies the style from your down hole data layers to the new section. You should therefore make sure that you are happy with your down hole data styles before generating sections. Note that you can change the down hole data style later, then regenerate the sections to update the section styles if required, but better to get it right the first time.
- Open the Section Manager by choosing Geoscience -> Drilling -> Section Manager or click the
 button on the toolbar.
 - Type in your desired section width.
- You have three options to create a section:
- Map Canvas – Use the mouse to draw a section line on the map canvas.
- West-East – Type in the Northing plus start and end Easting for the section.
- South-North – Type in the Easting plus start and end Northing for the section.
- If Map Canvas is chosen, you then click and drag a section to define the end points. Geoscience will display a moving box of defined section width to assist you. Your section is defined when you release the mouse button.
- Once a Map Canvas section is defined, or when you choose to define an orthogonal section, a dialog will ask you to select which vector and raster layers you want to include and choose a name for the section. Check the boxes next to the desired levels then click OK. Note that only vector layers with 3D coordinates and single band raster layers are displayed.
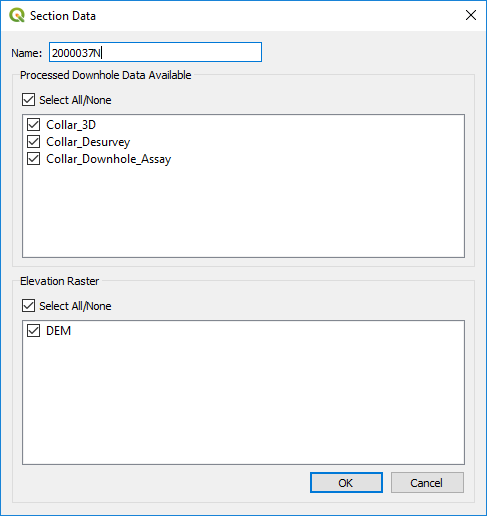
It may take some time to generate the section depending on how many drill holes you have. Once completed, a new drill hole will be added to the Section Manager, a new group containing your section is added to the Layer Tree and the Map Canvas will zoom to your new section.