
GIS layers are vector data: points, lines and polygons read from standard GIS files. They are drawn in the 3D scene alongside your surfaces, drillholes and volumes, and can be symbolised using their own attributes.
Hover over the GIS icon in the left flyout and click Load GIS … to open the GIS Settings dialog. You can also drag and drop files onto the GIS icon to load them straight into the scene with default settings, or drop them onto the Load GIS … button to open the dialog pre-filled.
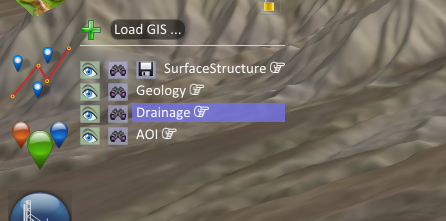
Loading a layer
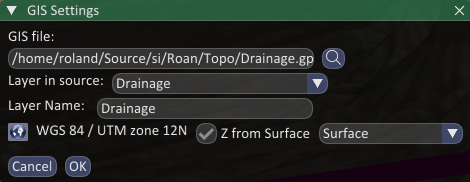
GIS file: Click the magnifier button to choose one or more files. Selecting more files adds them to the existing selection rather than replacing it. If you select several files, each one becomes its own layer and is named from its filename.
Layer in source: Many formats, such as GeoPackage, can hold several layers in a single file. Choose the one you want here. If the source contains more than one layer, the SI layer name is built as file|layer.
Layer Name: The name shown in the GIS flyout. Change it to something meaningful if you are loading several similar layers.
Default Height: This only appears when the source layer has no Z values. Every vertex is placed at this height. See 3D and 2D data below.
CRS: Click the CRS button to set the coordinate reference system if it isn’t stored in the file or is incorrect. Spatial Integration handles layers in any CRS and reprojects them into the scene. The chosen CRS is written to a .qpj file beside the data file so it is picked up next time. A layer with no valid CRS is flagged with a marker next to its name in the flyout.
Double-click a layer in the GIS flyout at any time to reopen this dialog and change its settings.
File formats
Spatial Integration supports a wide range of GIS formats, including:
- GeoPackage (.gpkg) : preferred, supports 3D coordinates.
- Shapefile (.shp, .shz)
- MapInfo (.tab, .mif/.mid)
- SQLite/Spatialite (.sqlite, .db)
- GeoJSON (.geojson, .json), TopoJSON, GML, KML, GMT, GPX
- DXF, DWG, DGN, Arc/Info E00, ESRI File Geodatabase (.gdb)
CSV files can’t be loaded as GIS layers. Use the Point Manager for those instead.
The libraries used by Spatial Integration support many GIS/vector formats that we haven’t tested. If you have problems loading any GIS formats then please contact us.
Note that some formats might not be picked up by drag-and-drop and be loaded as an Asset instead. Dragging directly onto the GIS icon or manual laoding should fix this.
Multipoint, multiline and multipolygon layer types are not supported and will be reported in the log. Multi-part features within a normal point, line or polygon layer are handled correctly, so Shapefiles with multi-part geometry work as expected.
3D and 2D data
If the source layer already has Z values, they are used directly and the layer is drawn at its true elevation.
If the layer is 2D, you have two choices:
- Leave Z from Surface unticked and set a Default Height. The whole layer is drawn flat at that height.
- Tick Z from Surface and choose one of your surfaces from the drop-down list. Every vertex is then sampled against that surface and draped over the topography.
Draping is done when the layer is built, so switching surfaces or toggling the option rebuilds the layer immediately. Any vertices that fall outside the surface keep their original height, and the number of missed points is reported in the log.
Saving a draped layer as 3D
Once a 2D layer has been draped, a Save (floppy disk) icon appears next to it in the GIS flyout. Click it to write the draped elevations back into the source file. The layer is converted in place to a 3D geometry type, the coordinates are transformed back into the file’s own CRS, and the layer then carries its own Z values so the link to the elevation surface is dropped and the Save icon disappears.
The file format must support creating, deleting and renaming layers for the conversion to work; this will be reported in the log if it doesn’t.
Display
Points are drawn as spheres with a Colour and a Radius. Lines are drawn with a Colour and a Width.
Polygons are drawn as an outline only, using the same line rendering as line layers. There is no fill, and interior rings (holes) are not drawn, although they are preserved if you save the layer.
Labels can be switched on from the tag button on the layer’s visualisation row in the flyout. Right-click the tag button to open the Label dialog where you can choose the attribute, size, precision, style (Fixed, Flag or Billboard), colours, opacity and offsets.
Symbology
Click the gear button on the layer’s visualisation row in the flyout to open the symbology editor. A colour swatch and a width (or radius) box are also shown directly on the row for quick changes when using single-value symbology.
Each of the Colour and Width classes can be set to:
- Single: one colour or width for the whole layer.
- Categorised: a colour or width per unique value of a chosen attribute.
- Graduated: bands of values of a chosen numeric attribute.
- Continuous: a smooth colour ramp or width transform across the range of a chosen numeric attribute.
For anything other than Single, choose the attribute to drive the symbology from the drop-down at the top of the class tab. Features with a null value fall back to the default class.
The Style button
The Style button at the bottom of the symbology editor lets you import and export symbology in a QGIS compatible format. It offers:
- Copy and Paste: put the current style on the system clipboard, or apply a style from it. You can copy a style in QGIS and paste it straight into Spatial Integration, copy from Spatial Integration into QGIS, or copy between layers within Spatial Integration. Styles copied between SI layers round-trip exactly, including colour ramps and transform anchor points.
- Import and Export: read or write a QGIS layer style (
.qml) file.
Paste is also available without opening the editor. Right-click a layer or visualisation in the flyout and choose Paste Style, or right-click a group and choose Paste Style to All to apply it to everything in the group. Select several layers first to style them all in one go.
Since QGIS has no continuous vector renderer, a continuous symbology is exported as a graduated approximation. Spatial Integration also stores the exact settings in a private section of the file, which QGIS ignores, so importing it back into Spatial Integration restores the original continuous symbology.
Automatic styles
If a .qml file with the same name as the data file sits beside it, it is applied automatically the first time the layer is loaded. This is a convenient way to keep the styling you set up in QGIS. Layers restored from a saved project keep the style stored in the project, so a sidecar .qml will not override your work.