
The Point Manager handles point data that is not already in a spatially aware format, most typically a CSV file of geochemical samples, survey pickups, gravity stations or any other list of coordinates with attributes attached.
Point data loaded here is imported into your project file as a snapshot. The rows are copied into an internal database inside the project, so the original file is no longer needed and later changes to it are not picked up. To re-import after the source has changed, simply load it again over the top of the existing dataset.
If you would rather keep your points live, so that they can still be edited by QGIS or another application, load them as a GIS layer instead. GIS layers read from the file every time, and points, lines and polygons all work the same way there. The trade-off is that a GIS point layer must be in a format that carries its own geometry; a plain CSV cannot be loaded that way.
Hover over the Point icon in the left flyout to reach Point Manager…. You can also drag and drop a point file onto the Point icon, or onto the Point Manager… button, to open the loader with the file already selected.
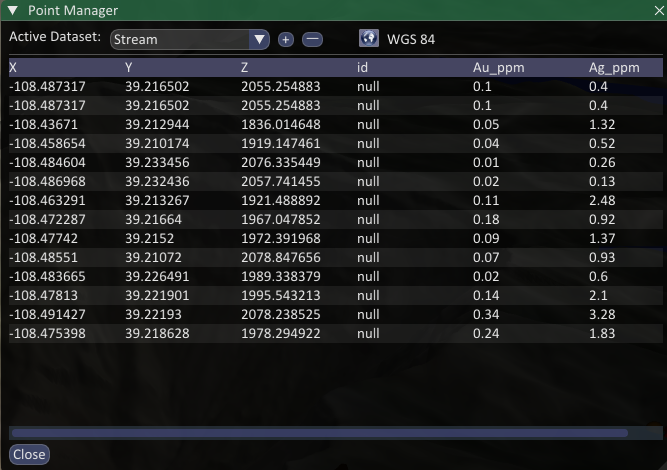
Point Datasets
Each import becomes a separate dataset, listed in the Active Dataset dropdown at the top of the dialog. The table below shows the contents of the active dataset: the X, Y and Z coordinates that were resolved during the import, followed by every attribute column that came with them.
- The plus button adds a new dataset by opening the Load Point dialog.
- The minus button deletes the active dataset. This removes the data from the project file and also removes the corresponding layer from the scene, so you will be asked to confirm.
Coordinate Reference System
Points are projected into whatever CRS your viewer is set to, so it is well worth telling Spatial Integration which CRS the points are actually in. Use the CRS button at the top of the dialog to set it. Changing the CRS here re-projects the dataset and rebuilds its layer in the scene immediately.
If no CRS is defined, the coordinates are assumed to already be in the viewer’s CRS and are used as they are. That is fine when everything in the project shares one system, but it will place your points in the wrong spot as soon as the viewer is set to something else.
A CRS read from a GIS source file is picked up automatically. CSV files carry no CRS, so you should always set one for them.
Loading Points
Click the plus button in the Point Manager, or drop a file onto the Point icon, to open the Load Point dialog.
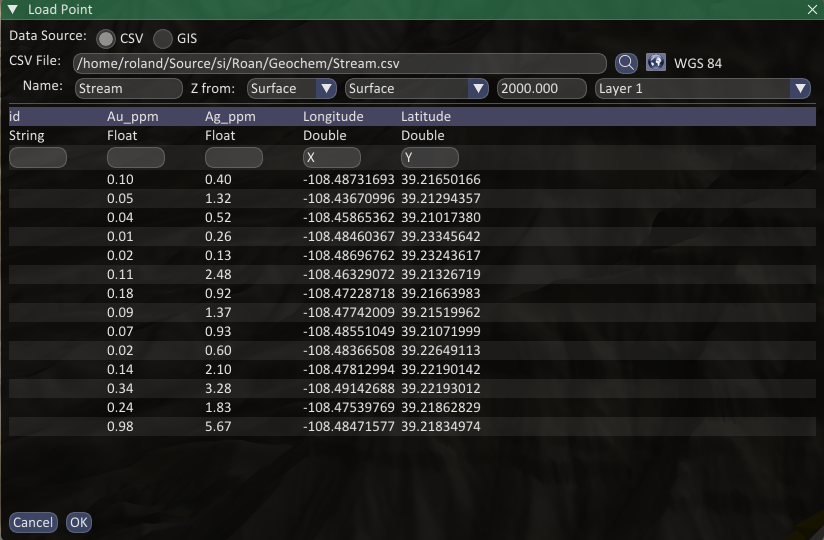
Data Source: Choose CSV for delimited text (.csv, .txt, .dat, .xyz) or GIS for any vector format that GDAL/OGR can read. If you dropped a file onto the Point icon, this is set from the file extension for you.
File: Use the magnifier button to browse for the file, or type the path directly. The path can also be filled by dropping a file onto the text box.
Name: The name of the dataset, taken from the file name by default. This is the name that appears in the Active Dataset list and in the Point flyout, so change it to something meaningful if the generated name is long or ambiguous. Loading with the name of an existing dataset will offer to replace it, which is how you refresh a snapshot.
CRS: As described above. Set it here at load time so the points are placed correctly from the start.
Layer: GIS formats such as GeoPackage can hold several layers in one file. Choose the one you want from the dropdown on the right.
Use Geometry: Shown for GIS point sources. Tick it to take the coordinates from the file’s own geometry rather than from attribute columns. If the geometry is 3D, the Z value comes from it as well.
Choosing the coordinate columns
The table in the lower half of the dialog previews the file. The first row under the column names shows the data type of each column, as detected from the source: String, Integer, Float or Double. Check these are what you expect before loading. A numeric column that has been read as String usually means there is stray text, a units symbol or an odd null marker somewhere in the data, and it will not be available for graduated or continuous symbology once it is imported.
The second row holds a dropdown for each column, where you nominate which columns are the coordinates: X, Y and, when the Z comes from an attribute, Z. Spatial Integration guesses these from the column names, looking for the usual variations of easting, northing and elevation, but you must check the guesses and correct them. Assigning a role to a column automatically clears it from any other column, so a role can only ever be used once.
Every other column is imported as an attribute and can be used later for labelling and symbology.
Z definition
The Z from dropdown controls where each point’s height comes from:
- Attribute: the height is read from a column in the file, nominated with the Z dropdown in the column list. This is the usual choice when your data has an elevation or RL field.
- Surface: the points are draped on one of your elevation surfaces. Choose the surface from the dropdown next to it. The surface must already exist in the project.
- Fixed: every point is placed at the same height, typed into the number box.
The number box next to the Z from dropdown does double duty. With Fixed it is the height given to every point. With Surface it is the default height, used for any point that falls outside the extent of the surface, so those points end up at a sensible level instead of being lost. Set it to something close to the local ground level for the area.
Draping is done as the points are imported, so the heights are baked into the snapshot. If you later change or extend the surface, load the points again to re-drape them.
Click OK to import. The Point Manager reappears while the data loads and the new dataset becomes the active one when it is finished. Check the messages (the envelope icon in the bottom right) afterwards for any rows that were rejected.
Adding Points to the Scene
Importing a point dataset does not put it in the scene. That is a separate step, which lets you keep reference data in the project without drawing it.
To display a dataset, hover over the Point icon in the left flyout, hover over Add Point Dataset and choose the dataset you want from the list that appears. It is added as a layer in the Point flyout, where it can be shown, hidden, symbolised and labelled like any other layer.