Histogram plots are a popular method for displaying down hole data. The method below allows you to produce histograms using existing output from the Geoscience plugin and the Geometry Generator built into QGIS.
We are going to take the line that Geoscience already produces from the Downhole Data processing and convert it into a polygon by extruding it in the correct direction. How do we know the correct direction? The direction is perpendicular to the drill trace as displayed in the current plan or section. Fortunately, Geoscience has already calculated view-dependent values in order to draw the line segments and QGIS’ Geometry Generator can do the extrusion.
The easy way first – download the style file from the link below that already includes the equations we need. I have a qgis/styles directory in my home directory to keep these things together.
- Double click your _Downhole_ layer that is already displaying line segments.
- Go to the Symbology page, click the Style button at the bottom and Load Style. Load the downloaded qml file.
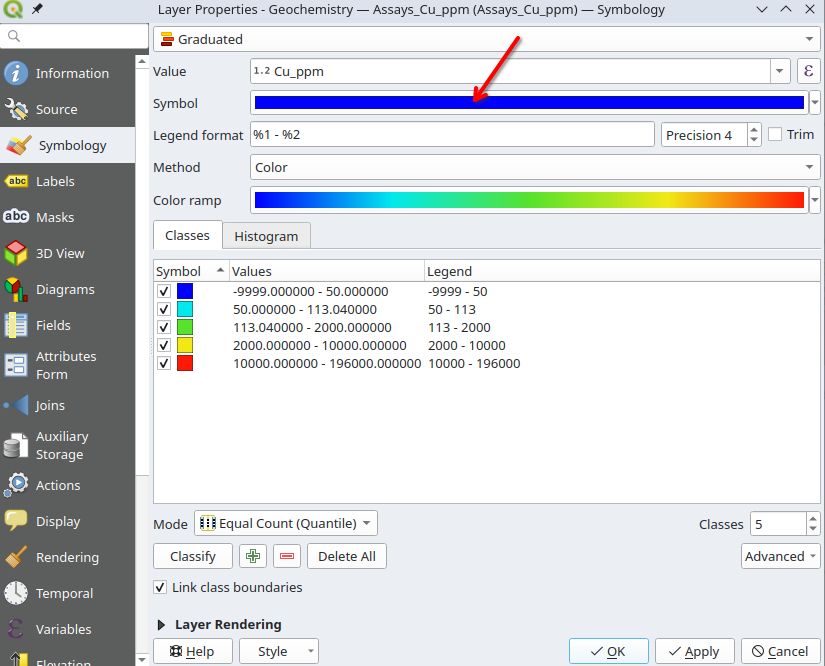
Left click the symbol box (to the right of the word Symbology) then click on Geometry Generator.

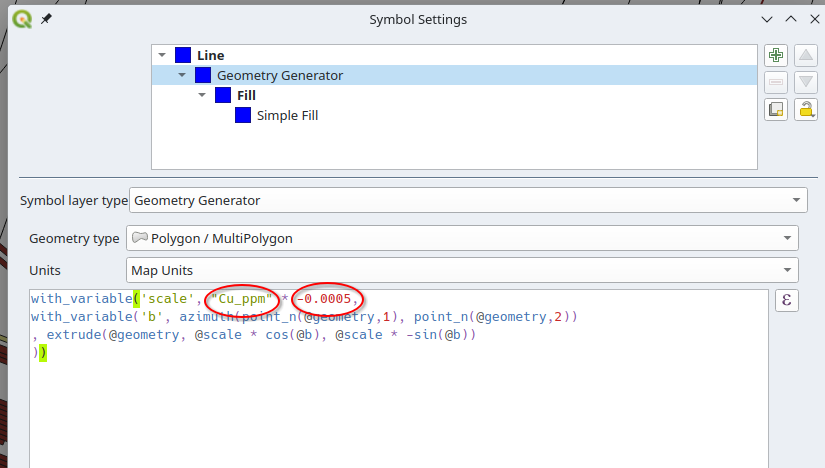
You need to change the attribute field and scale factor from the default ones in the style file. The image below shows what to change. Make sure the attribute string exactly matches the one in your data and set the scale to something appropriate for the amplitude of your data (try 1 for Au in ppm or 0.005 for Cu in ppm). A positive scale puts the histogram on the left of the drill trace and a negative scale puts the histogram on the right.

This works for for both plans and sections and remember that you can copy and paste styles by rick clicking on the layer and selecting Styles from the context menu.

