Now Available in Early Access
Spatial Integration is now in Early Access and is available for Windows and Linux. Visit the Downloads page!
Promotion Video
See the features of Spatial Integration in action in the new promotion video
A new direction
In developing Spatial Integration we decided to take several different paths in the areas of visual performance, user interface and large data capability. It is also essential that SI be available across a range of operating systems and platforms.

Graphics
We wanted SI to have high quality, high performance graphics that modern AAA games would be proud of, while not compromising on rendering transparency in a scene where any or all of the objects could be transparent! This means choosing the latest graphics API, Vulkan. Vulkan is the successor to OpenGL and can be used across Windows, Linux, MacOS and Android.
SI introduces a new user interface that takes inspiration from the gaming industry. We didn’t want the standard menu – side panels – bottom panel framework taking up valuable screen space that could be showing your data, so we implemented a slide-out interface that floats over the top of your data when it’s needed and slides out of the way as soon as you’re done. The only permanent part of the user interface is a thin status bar at the bottom.
Large Data Handling
Data sizes are getting bigger and bigger, so any new 3D visualisation system needs to be able to support these huge data sets. SI uses a data paging system that will pull in data as it’s required in the scene at the right level of detail for the current zoom level. All the paging and data preparation happens in background threads so that your 3D view continues at full frame rates. For example, with SI you can create a surface with SRTM data of the world mixed with centimetre scale Lidar of your project and smoothly zoom from a global view to individual rocks laying on the ground. All this while mixing multiple overlaid images using transparency sliders.
The data paging system in SI greatly reduces the amount of data held in memory, meaning that you can do more with less computing power.


Drill Holes – Points – External 3D Assets
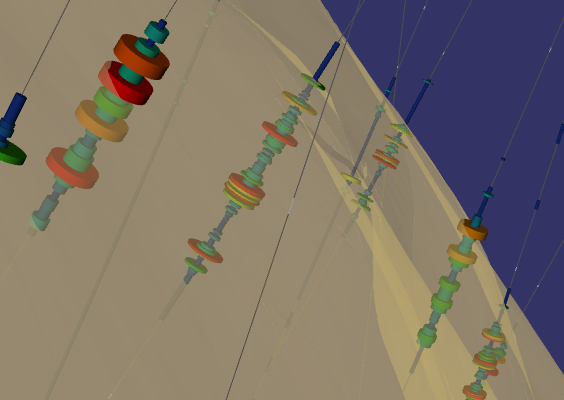
Spatial Integration can handle your drill hole data too. Intervals can be displayed as discs with colour and radius controlled separately, or as downhole bar and line graphs. You can display as many elements as you like on either side of the hole trace and they turn to face the user as the scene is rotated.
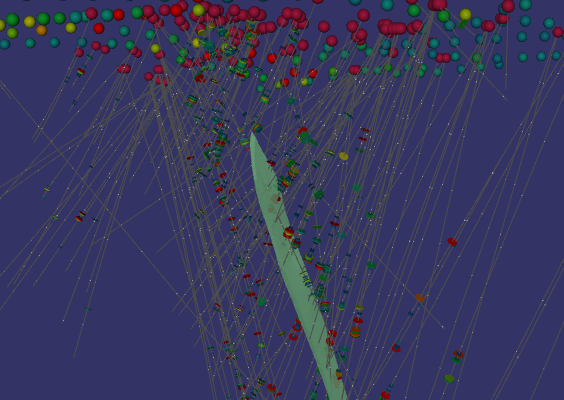
Point data isn’t forgotten with locations marked by spheres of data dependant colour and radius.
You probably already have 3D shapes created in other software. SI can import most 3D formats and still allow you to control colour and transparency.
Coordinate Reference Systems
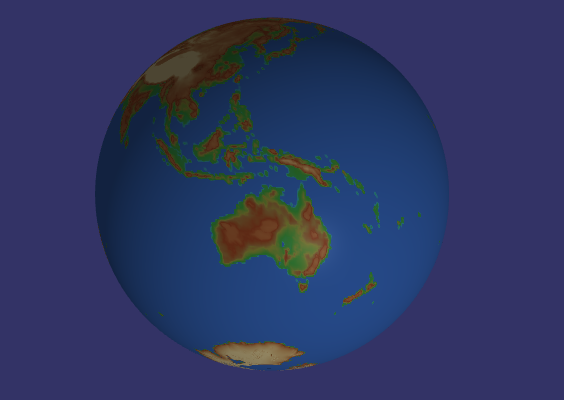
Spatial Integration will take care of your Coordinate Reference System transforms for you as well. You can mix and match between spherical and projected coordinate systems as well as displaying your viewer as projected (flat) or spherical (a globe). There are thousands of CRS in our database and everything is re-projected on-the-fly.
Tools
The tool set in Spatial Integration is expanding rapidly. Current tools include:
